/
Chart, Crosstab, and Table Dashlets
The following macros are not currently supported in the header:
- style
YOU ARE CURRENTLY ACCESSING AN OUTDATED VERSION OF THE ZOOLA HELP DOCUMENTATION
Go to https://help.zoola.io for up-to-date documentation, videos, walkthroughs, and case studies.
![]()
Chart, Crosstab, and Table Dashlets
- Zaqir Virani (Unlicensed)
Owned by Zaqir Virani (Unlicensed)
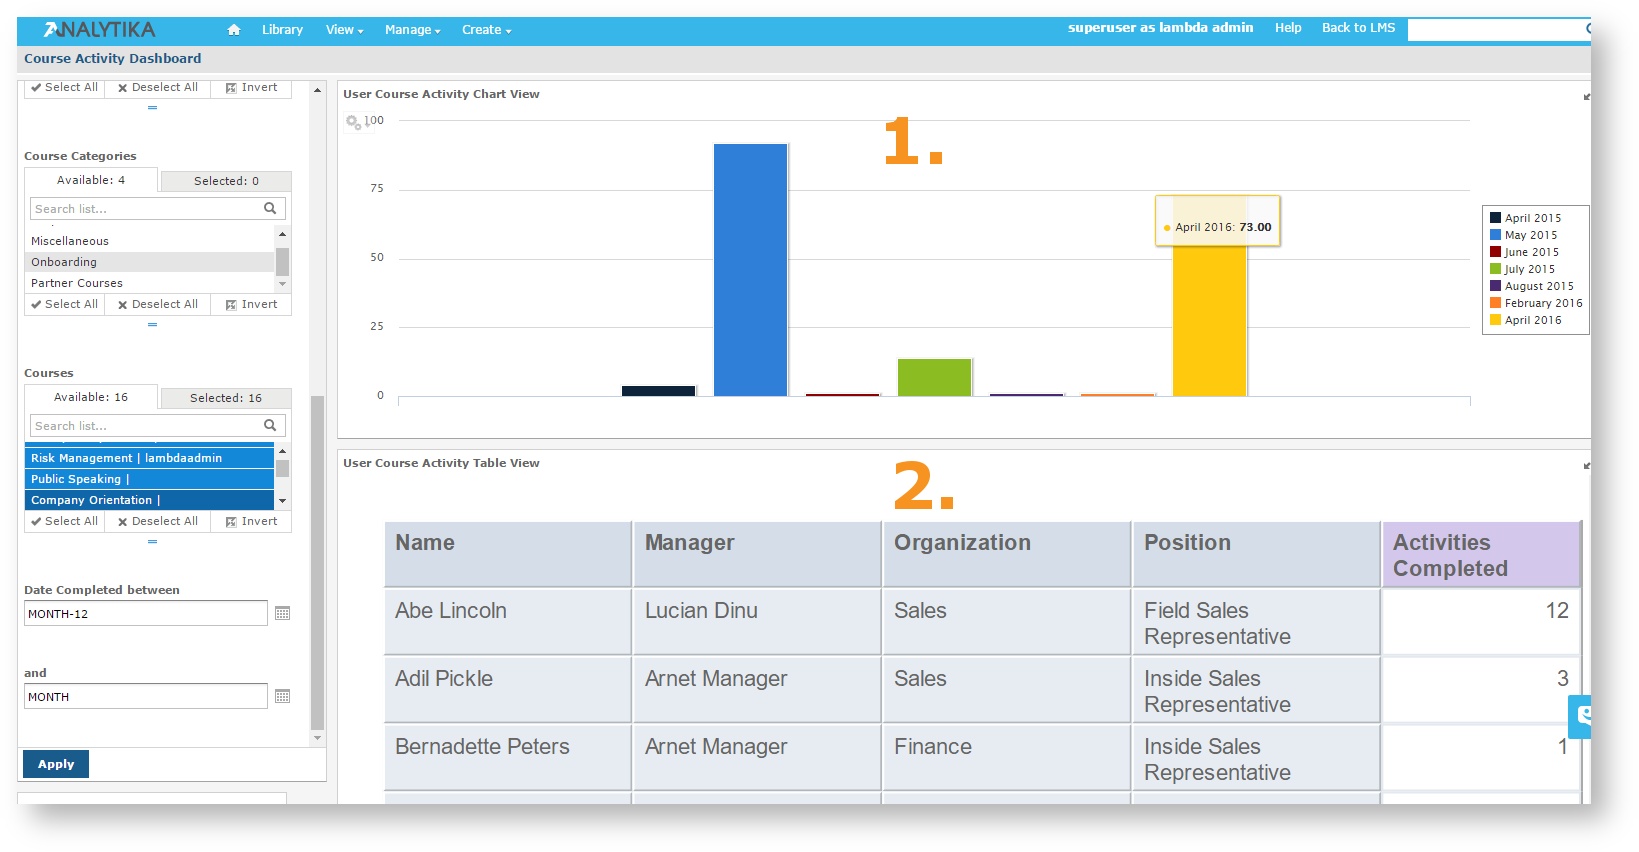
The heart of creating a Lambda Zoola™ Dashboard is the ability to include and cross-reference Charts, Crosstabs, and Tables as Dashlets. In the image below, the Course activity Dashboard contains:
- User Activity Course Chart View
- User Activity Course Table View
The Dashboard Designer interface allows you to include Charts, Tables, and Crosstabs as Dashlets in two unique ways:
- Existing Charts, Crosstabs, and Tables: The Lambda Zoola™ Dashboard Designer allows you to select existing Charts, Crosstabs, and Tables to include in your Dashboard (if you have the necessary permissions to view and use them).
- New Charts, Crosstabs, and Tables: The Dashboard Designer includes an on-board Ad Hoc Editor, which allows you to create Charts, Crosstabs, and Tables for your Dashboard without leaving the designer environment (any Chart, Crosstab, or Table you create within the Dashboard Designer is only available on the current Dashboard; otherwise, they function like standard Ad Hoc Editor-created versions of these elements. They are saved as an Ad Hoc view, and placed in a Dashlet on your dashboard).
, multiple selections available,
Related content
Text Dashlets
Text Dashlets
More like this
Image Dashlets
Image Dashlets
More like this
Introduction to Dashboards
Introduction to Dashboards
More like this
Dashboard Designer Overview
Dashboard Designer Overview
More like this
Adding Chart, Crosstab, and Table Dashlets
Adding Chart, Crosstab, and Table Dashlets
More like this
The Dashboard Designer
The Dashboard Designer
More like this
Copyright © Lambda Zoola™